Dashboard | Smart Data Generator Documentation
Dashboard documentation.
Overview
The Dashboard provides a central overview of generated data, license status, usage limits, and visual analytics for Smart Data Generator. It is the main entry point for monitoring how the application is used across the Jira instance.
Application License Status
Smart Data Generator uses a simplified two-state license model:
ACTIVE
The license is considered ACTIVE when:
- a trial license is enabled, or
- a valid license is installed
Limits for ACTIVE license:
- Active Projects: up to 1000
- Object Limits: no limits on issues or sprints
- All generation modules operate without restrictions except functional module limits (e.g., 20 issues/sprint).
INACTIVE
The license is INACTIVE when:
- no license is installed
- the license is expired
- the app runs without a valid trial or valid subscription
Limits for INACTIVE license:
- Active Projects: maximum 50
- Generation limits:
- Issues: up to 10000
- Sprints: up to 1000
- Projects: up to 100
- Global object cap: fully enforced across all modules
Jira Product Licenses
Jira Software and Jira Service Management licenses are displayed unchanged.
Each may be in one of the following states:
- ACTIVE
- FREE
- UNLICENSED
These values indicate whether project types related to those products can be used.
Usage and Limits
The Dashboard presents current usage, lifetime counts, and limits for all generated objects.
The information is divided into three groups:
Projects
- Active: number of currently existing generated projects
- Generated (Total): lifetime total
- Deleted: number of generated projects removed
- Limit: depends on application license
- INACTIVE : up to 100 generated in total, max 50 active
- ACTIVE: unlimited generated, max 1000 active
Issues
- Active: number of generated issues that currently exist
- Generated (Total): number of issues created since installation
- Deleted: number of generated issues that were removed
- Limits:
- INACTIVE : up to 10,000 total
- ACTIVE: unlimited
Sprints
- Active: number of generated sprints currently present
- Generated (Total): total number of generated sprints since installation
- Deleted: number of generated sprints that were removed
- Limits:
- INACTIVE : up to 1,000 total
- ACTIVE: unlimited
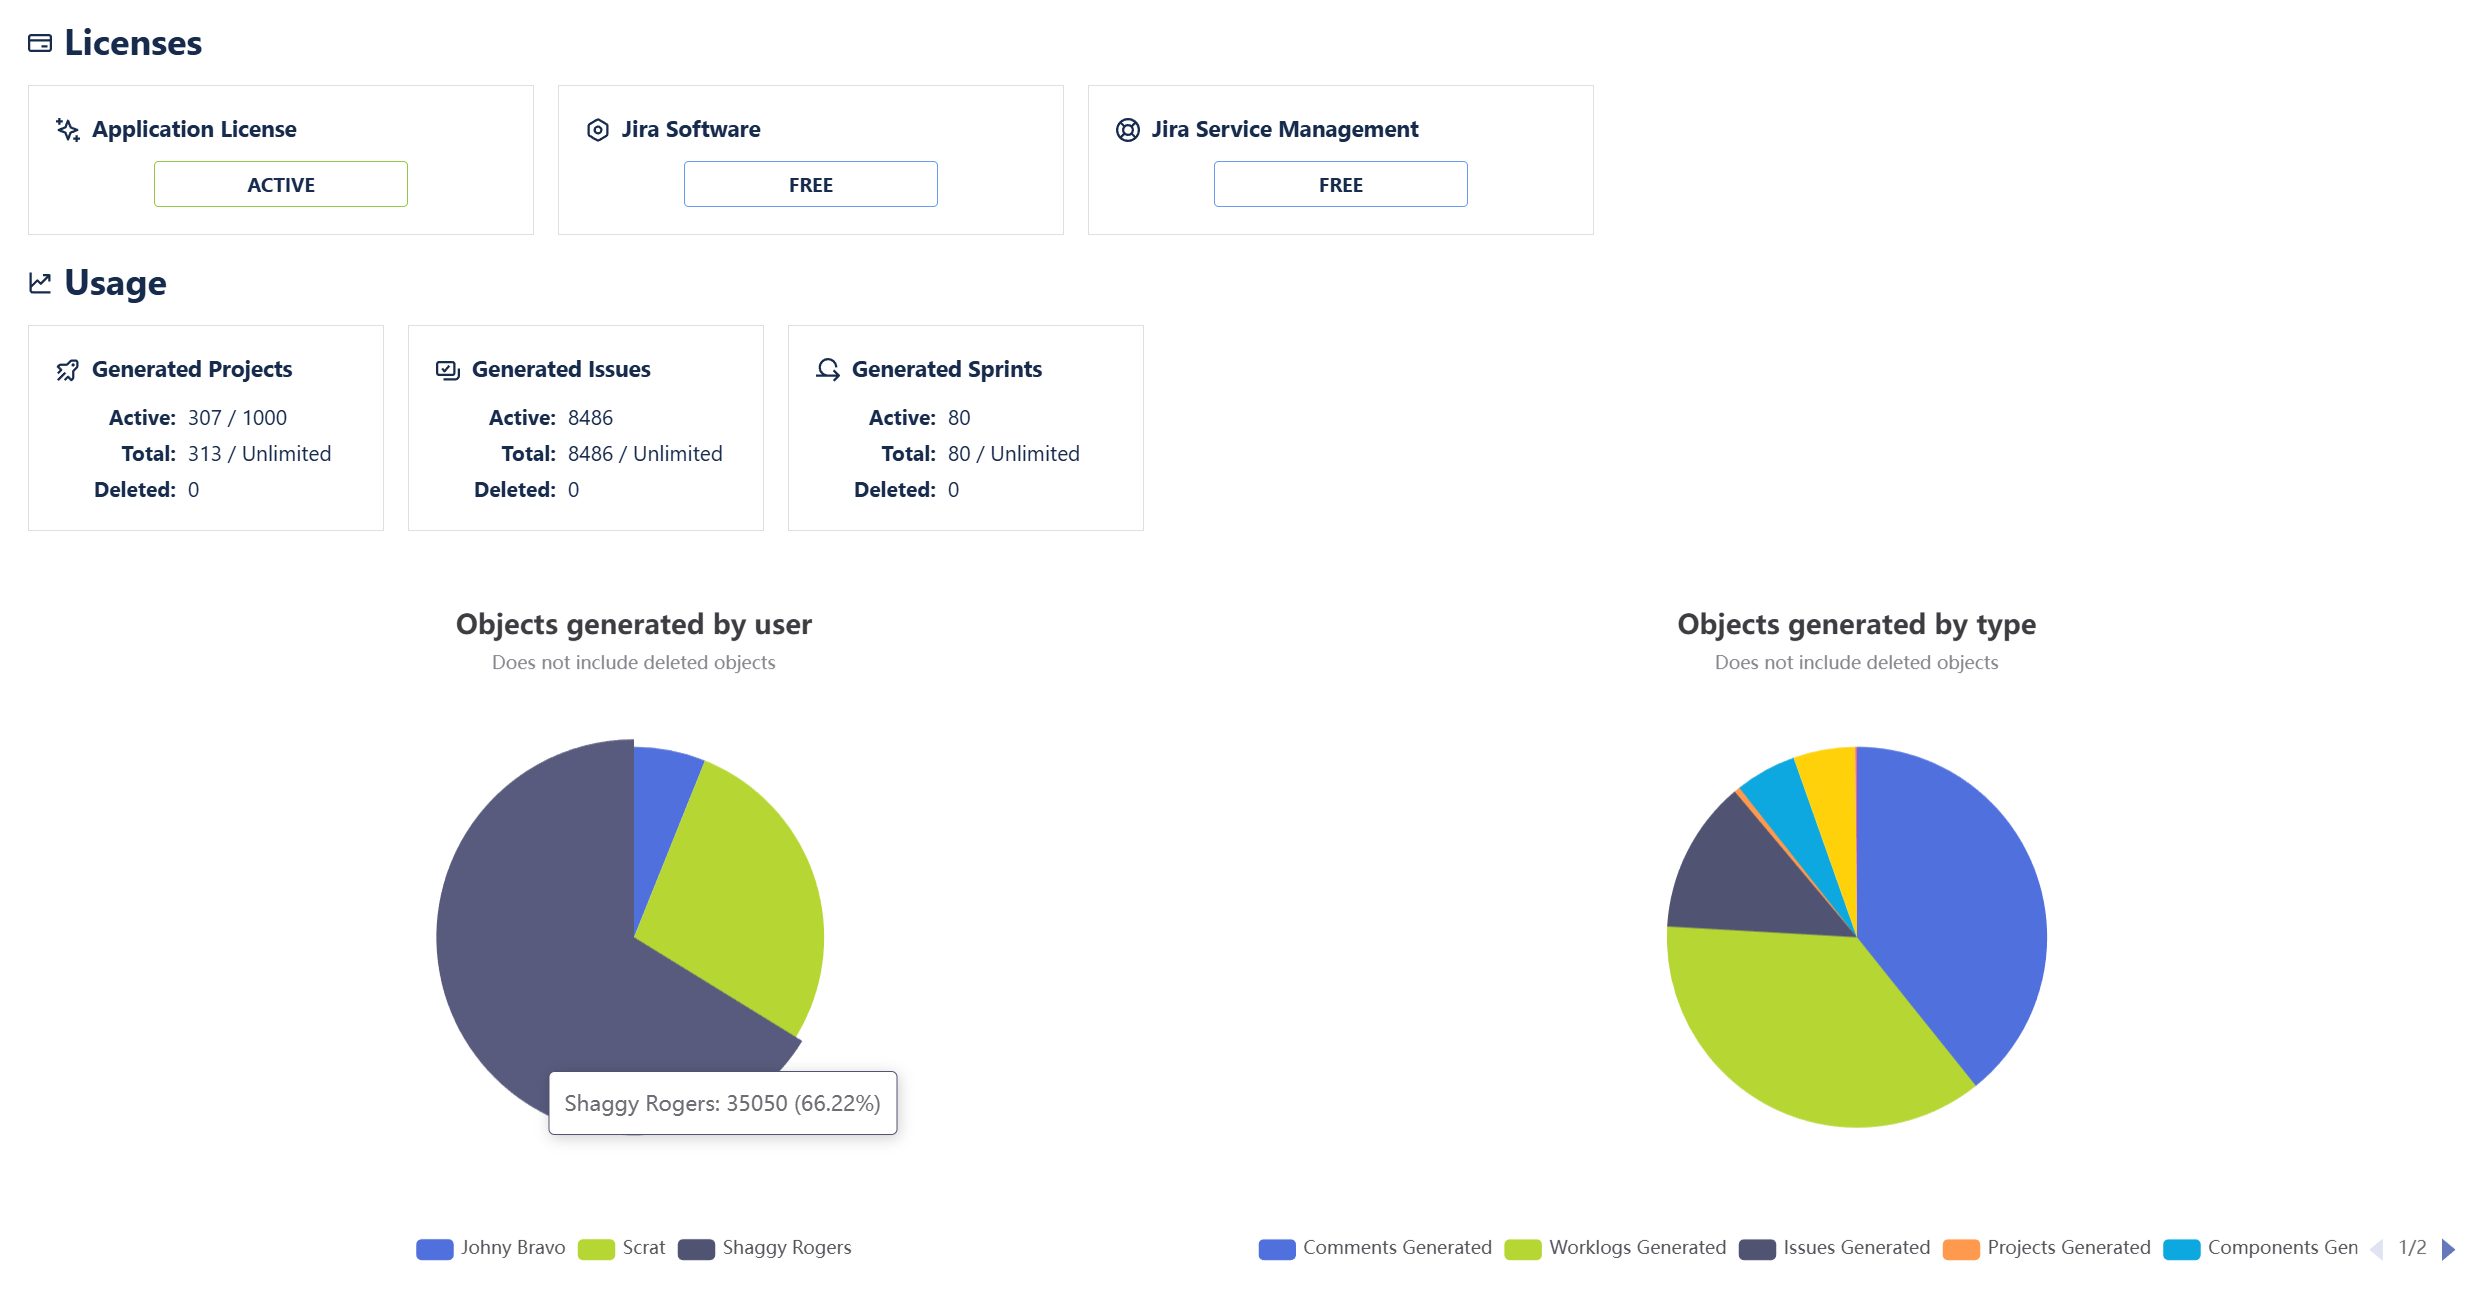
Charts
Two charts visualize generation patterns:
1. Objects Generated by User
Shows how many objects each user generated.
Useful for tracking usage across teams and environments.
2. Objects Generated by Type
Displays a breakdown of all generated objects:
- Projects
- Components
- Versions
- Issues
- Sprints
- Comments
- Worklogs
This helps understand what kinds of data are produced most frequently.